class: center, middle, title # UE Visualisation ### 2019-2020 ## Dr. Maxime Wack ### AHU Informatique médicale #### Hôpital Européen Georges Pompidou, </br> Université de Paris --- # Graphe bipartite .pull-left[ ### Graphe contenant deux sets de sommets **complèment déconnectés** ### Dit aussi 2-coloriable ] .pull-right[ 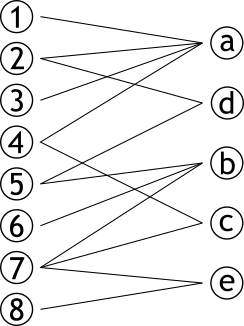 ] --- # Projection .pull-left[ ### Méthode permettant de créer **deux** graphes ### Les sommets d'une partie sont connectés s'ils partagent un sommet d'une autre partie ] .pull-right[  ] --- # Projection .pull-left[ ### Méthode permettant de créer **deux** graphes ### Les sommets d'une partie sont connectés s'ils partagent un sommet d'une autre partie ] .pull-right[  ] --- # Projection .pull-left[ ### Méthode permettant de créer **deux** graphes ### Les sommets d'une partie sont connectés s'ils partagent un sommet d'une autre partie ] .pull-right[  ] --- # Projection .pull-left[ ### Méthode permettant de créer **deux** graphes ### Les sommets d'une partie sont connectés s'ils partagent un sommet d'une autre partie ] .pull-right[  ] --- # Projection .pull-left[ ### Méthode permettant de créer **deux** graphes ### Les sommets d'une partie sont connectés s'ils partagent un sommet d'une autre partie ] .pull-right[  ] --- # Projection .pull-left[ ### Méthode permettant de créer **deux** graphes ### Les sommets d'une partie sont connectés s'ils partagent un sommet d'une autre partie ] .pull-right[  ] --- # Projection .pull-left[ ### Méthode permettant de créer **deux** graphes ### Les sommets d'une partie sont connectés s'ils partagent un sommet d'une autre partie ] .pull-right[  ] --- class:center # Projection .pull-right[  ] --- class:center # Projection .pull-left[ 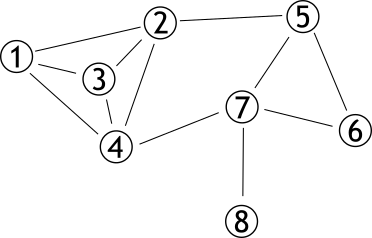 ] .pull-right[  ] --- class:center # Projection .pull-c1[  ] .pull-c2[  ] -- .pull-c3[  ] --- # OMIM *Online Mendelian Inheritance in Men* Base de données d'associations connues gène ↔ phénotype https://omim.org https://maximewack.com/files/OMIM.csv --- class: center # The Human Disease Network https://www.ncbi.nlm.nih.gov/pubmed/17502601 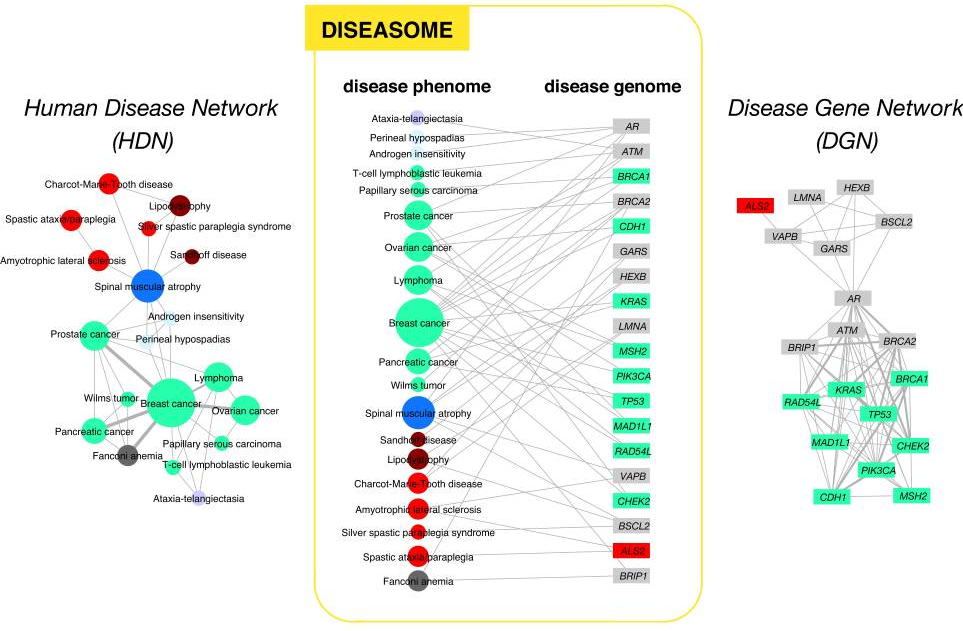 --- class: center # The Human Disease Network https://www.ncbi.nlm.nih.gov/pubmed/17502601 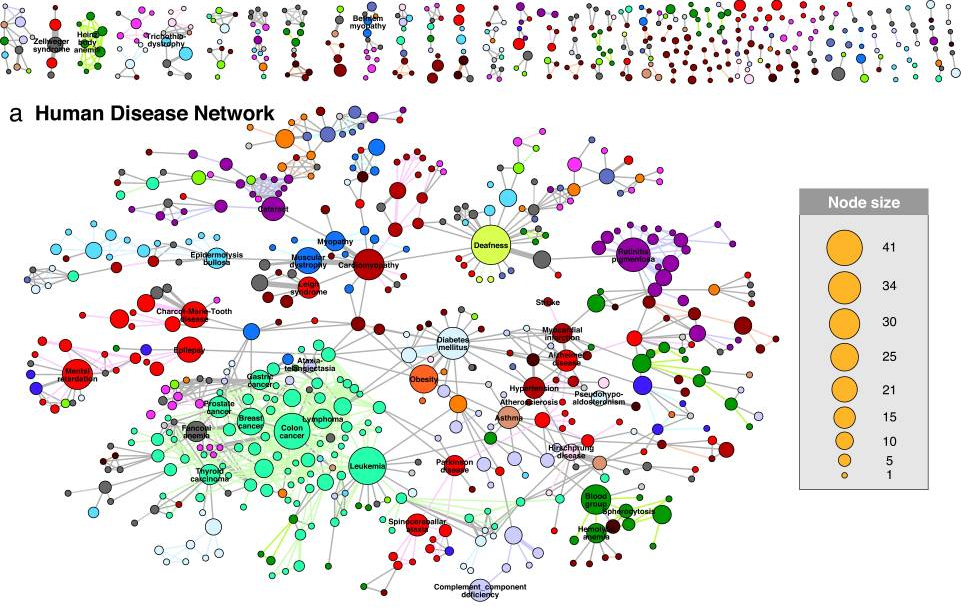 --- # Librairies ```r library(igraph) library(ggraph) library(tidyverse) ``` --- class:center,middle # igraph --- # Créer des graphes ```r # Graphe sans arête graph.empty(n = 10, directed = T) # Graphe complètement connecté graph.full(n = 10, directed = F, loops = F) # Graphe en étoile graph.star(n = 10, mode = "out") ``` --- # Chargement du graphe ```r read_csv("lab06_data/OMIM.csv") -> OMIM ``` <div id="htmlwidget-e2536eee24b80cd7b4a4" style="width:100%;height:auto;" class="datatables html-widget"></div> <script type="application/json" data-for="htmlwidget-e2536eee24b80cd7b4a4">{"x":{"filter":"none","data":[["ACYL-CoA DEHYDROGENASE, SHORT-CHAIN, DEFICIENCY OF","ADAMS-OLIVER SYNDROME 1","ADAMS-OLIVER SYNDROME 2","ADAMS-OLIVER SYNDROME 3","ADENINE PHOSPHORIBOSYLTRANSFERASE DEFICIENCY","LUNG CANCER","LUNG CANCER","LUNG CANCER","LUNG CANCER","LUNG CANCER","LUNG CANCER"],["ACADS","ARHGAP31","DOCK6","RBPJ","APRT","CYP2A6","EGFR","TNFSF6","IRF1","BRAF","ERBB2"]],"container":"<table class=\"display\">\n <thead>\n <tr>\n <th>Disease<\/th>\n <th>Gene<\/th>\n <\/tr>\n <\/thead>\n<\/table>","options":{"paging":false,"search":false,"info":false,"order":[],"autoWidth":false,"orderClasses":false}},"evals":[],"jsHooks":[]}</script> --- # Chargement du graphe ```r graph.data.frame(OMIM, directed = F) -> graphe ``` ``` ## IGRAPH d3876e8 UN-- 6288 4234 -- ## + attr: name (v/c) ## + edges from d3876e8 (vertex names): ## [1] ADRENAL HYPERPLASIA, CONGENITAL, DUE TO 17-ALPHA-HYDROXYLASE DEFICIENCY--CYP17A1 ## [2] 17-BETA-HYDROXYSTEROID DEHYDROGENASE X DEFICIENCY --HSD17B10 ## [3] 2-METHYLBUTYRYL-CoA DEHYDROGENASE DEFICIENCY --ACADSB ## [4] THREE M SYNDROME 1 --CUL7 ## [5] THREE M SYNDROME 2 --OBSL1 ## [6] 3-METHYLCROTONYL-CoA CARBOXYLASE 1 DEFICIENCY --MCCC1 ## [7] 3-METHYLCROTONYL-CoA CARBOXYLASE 2 DEFICIENCY --MCCC2 ## + ... omitted several edges ``` --- # Informations sur le graphe ### Sommets ```r vcount(graphe) ``` ``` ## [1] 6288 ``` ### Arêtes ```r ecount(graphe) ``` ``` ## [1] 4234 ``` --- # Informations sur le graphe ### Dirigé ? ```r is.directed(graphe) ``` ``` ## [1] FALSE ``` ### Voisins d'un sommet ```r neighbors(graphe, V(graphe)[2019]) ``` ``` ## + 1/6288 vertex, named, from d3876e8: ## [1] SLC25A3 ``` --- # Projection ```r # Établir les types (gène, phénotype) V(graphe)$type <- bipartite.mapping(graphe)$type # Créer les projections projs <- bipartite.projection(graphe) # Séparer les projections en deux graphes HDN <- projs$proj1 HGN <- projs$proj2 ``` --- # HDN ```r HDN ``` ``` ## IGRAPH 58fb0bd UNW- 3512 2839 -- ## + attr: name (v/c), weight (e/n) ## + edges from 58fb0bd (vertex names): ## [1] 17-BETA-HYDROXYSTEROID DEHYDROGENASE X DEFICIENCY--MENTAL RETARDATION, X-LINKED 17 ## [2] 17-BETA-HYDROXYSTEROID DEHYDROGENASE X DEFICIENCY--MENTAL RETARDATION, X-LINKED, SYNDROMIC 10 ## [3] 3-HYDROXYACYL-CoA DEHYDROGENASE DEFICIENCY --HYPERINSULINEMIC HYPOGLYCEMIA, FAMILIAL, 4 ## [4] 3-METHYLGLUTACONIC ACIDURIA, TYPE III --OPTIC ATROPHY 3, AUTOSOMAL DOMINANT ## [5] 46,XX SEX REVERSAL 1 --46,XY SEX REVERSAL 1 ## + ... omitted several edges ``` --- # HGN ```r HGN ``` ``` ## IGRAPH f5f35d8 UNW- 2776 2810 -- ## + attr: name (v/c), weight (e/n) ## + edges from f5f35d8 (vertex names): ## [1] AKR1C2--AKR1C4 LMNA --MYBPC3 LMNA --ZMPSTE24 GNAS --SSTR5 ## [5] GNAS --AIP GNAS --STX16 GNAS --GNASAS1 COL2A1--COL11A2 ## [9] FGFR3 --KRAS FGFR3 --HRAS FGFR3 --RB1 FGFR3 --PIK3CA ## [13] FGFR3 --AKT1 FGFR3 --APC FGFR3 --TP53 FGFR3 --NRAS ## [17] FGFR3 --FLCN FGFR3 --MLH3 FGFR3 --ODC1 FGFR3 --CCND1 ## [21] FGFR3 --PLA2G2A FGFR3 --PTPRJ FGFR3 --EP300 FGFR3 --BUB1B ## [25] FGFR3 --TLR2 FGFR3 --TLR4 FGFR3 --AURKA FGFR3 --BCL10 ## [29] FGFR3 --AXIN2 FGFR3 --PDGFRL FGFR3 --KIT FGFR3 --STK11 ## + ... omitted several edges ``` --- # Décomposition en sous-graphes ```r HDN %>% decompose -> diseases ``` --- # ggraph ```r graph_one <- function(graph) { ggraph(graph) + geom_edge_diagonal() + geom_node_label(aes(label = name)) } ``` --- # Filtrer sous-graphes < 10 sommets ```r diseases %>% keep(map_dbl(diseases, vcount) >= 10) %>% map(graph_one) -> plots ``` --- # Malformations cardiaques ```r plots[[5]] ``` 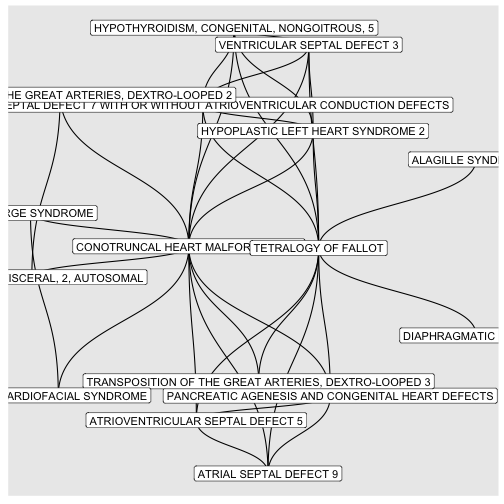<!-- --> --- # Surdités ```r plots[[9]] ``` <!-- --> --- # Ostéogénèses imparfaites ```r plots[[12]] ``` <!-- --> --- # Export ```r write.graph(HDN, file = "diseases.graphml", format = "graphml") write.graph(HGN, file = "genes.graphml", format = "graphml") ```