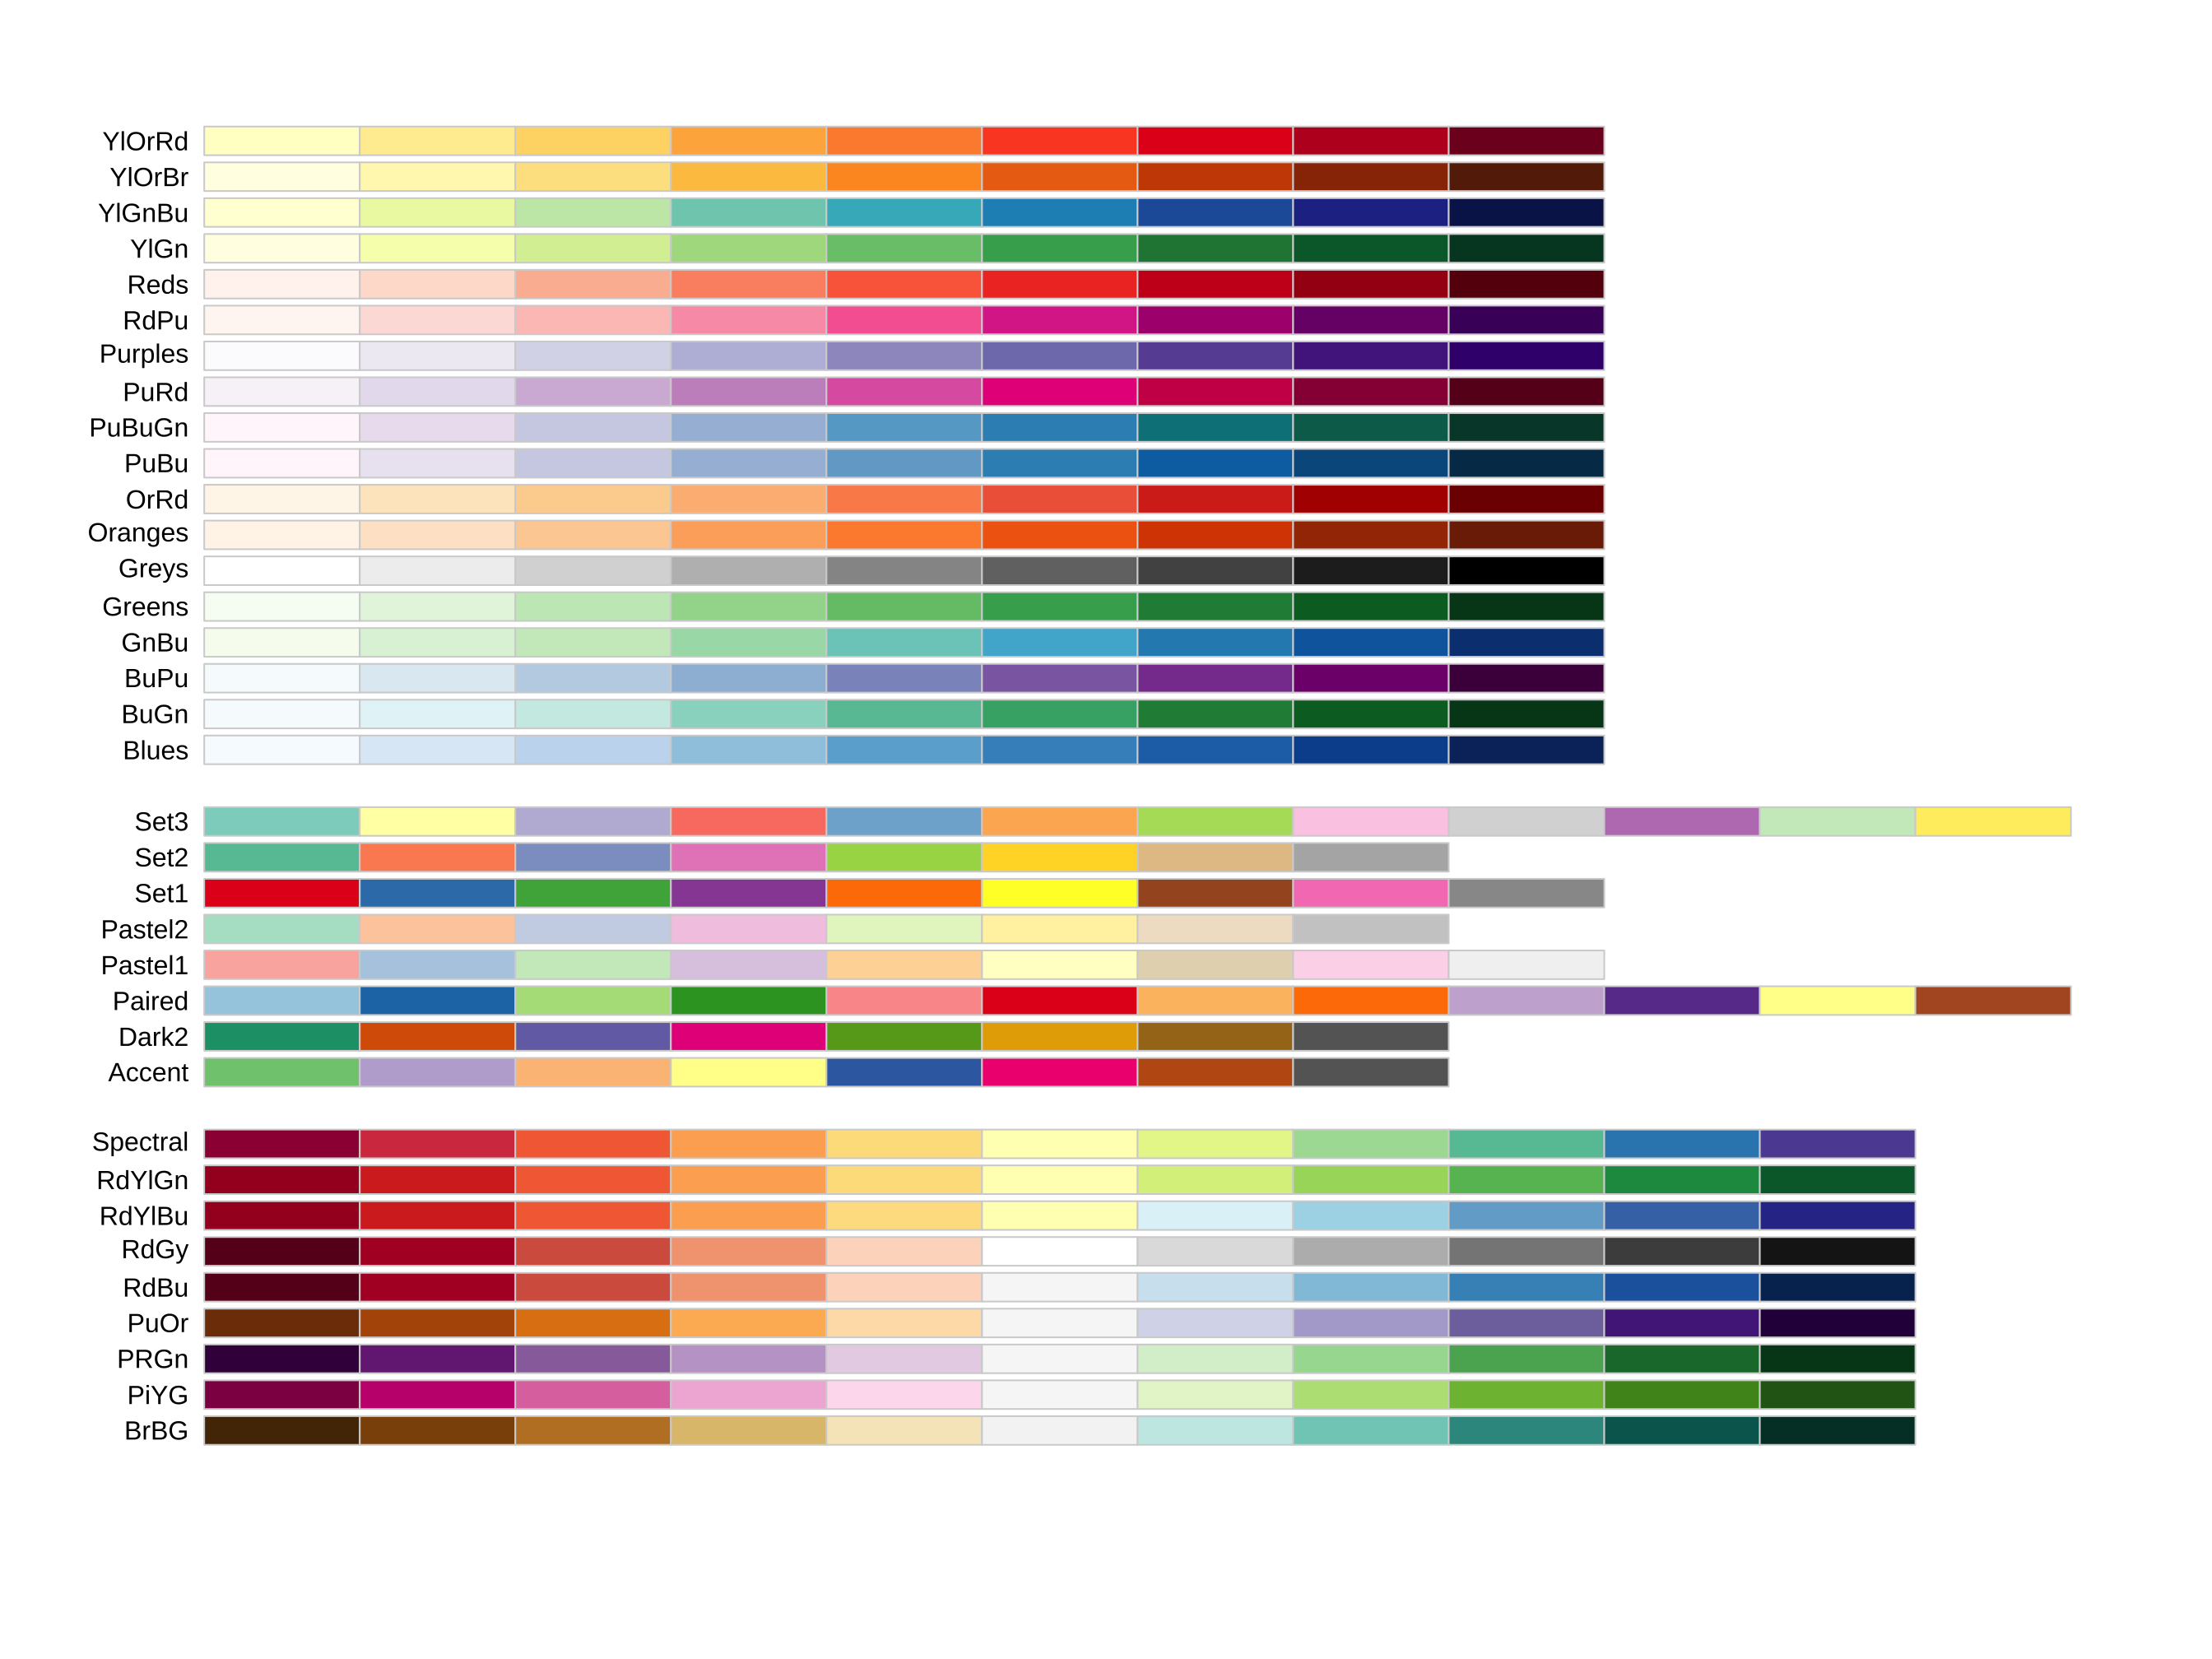
--- class: inverse, center, middle # Perception des différentes marques dans ggplot2 --- ## TODO: échauffement #### Générer un dataset aléatoire avec la fonction vizoR::generate_dataset_uniform ```r size <- list(100, 2) min_x <- 0 max_x <- 1 seed <- 34 ``` --- ## TODO: perception #### 1. Réaliser des plots avec les échelles suivantes sur la variable group : - couleur - forme - angle - taille - luminosité - courbe - encapsulage - remplissage Certaines échelles sont très simples à mettre en place (e.g. couleur, forme) mais d'autres n'existent pas directement. Il faut trouver une alternative. #### 2. Comparer l'efficacité des différentes échelles pour distinguer les 2 groupes --- ## Couleur -- .small[ ```r p_color <- ggplot( data = dt, aes(x = x, y = y, color = group)) + geom_point(size = 3, alpha = .6) + see::scale_color_material_d() + vizoR::theme_void_complete() + labs(subtitle= "Couleur") p_color ``` <!-- --> ] --- ## Angle -- .small[ ```r p_angle <- dt %>% mutate(angle = ifelse(group == "group1", 0, pi / 3)) %>% ggplot( data = ., aes( x = x, y = y, angle = angle ) ) + geom_spoke(radius = 0.02,size = .8, alpha = .6 ) + theme_void_complete() + scale_color_material_d() + ggtitle("Angle") p_angle ``` <!-- --> ] --- ## Taille -- .small[ ```r p_size <- dt %>% mutate(size = ifelse(group == "group1", 2, 3)) %>% ggplot( data = ., aes( x = x,y = y,size = size)) + geom_point(alpha = .6) + theme_void_complete() + scale_size(range = c(1, 3)) + ggtitle("Taille") p_size ``` <!-- --> ] --- ## Luminosité -- .small[ ```r p_grey <- dt %>% ggplot( data = .,aes(x = x,y = y,color = group)) + geom_point(size = 3, alpha = .6) + theme_void_complete() + #scale_color_grey() + scale_color_grey(start=.8, end=.2)+ ggtitle("Luminosité") p_grey ``` <!-- --> ] --- ## Courbe -- .small[ ```r dt <- dt %>% mutate(curvature = ifelse(group == "group1", 0, 1)) p_curve <- dt %>% ggplot(data = .,aes(x = x,y = y,xend = x, yend = y+max_x/50, curvature = curvature)) + #geom_curve()+ geom_curve(data = subset(dt, group == 'group1'), curvature = 0, alpha = .7) + geom_curve(data = subset(dt, group == 'group2'), curvature = .7, alpha = .7) + scale_color_material_d() + theme_void_complete() + ggtitle("Courbe") p_curve ``` <!-- --> ] --- ## Encapsulage -- .small[ ```r p_box <- dt %>% ggplot(data = .,aes(x = x,xend = x+max_x/50,y = y,yend = y, group = group)) + geom_point(data = subset(dt, group=='group2'),aes(x = x+max_x/100), shape = 22, size = 13) + geom_segment() + scale_color_material_d() + theme_void_complete() + ggtitle("Encapsulage") p_box ``` <!-- --> ] --- ## Forme -- .small[ ```r p_shape <- dt %>% ggplot(data = .,aes(x = x,y = y,shape = group)) + geom_point(size = 3, alpha = .6) + theme_void_complete() + ggtitle("Forme") p_shape ``` <!-- --> ] --- ## Remplissage -- .small[ ```r p_fill <- dt %>% ggplot(data = ., aes( x = x,y = y,fill = group)) + geom_point(size = 3, shape = 21, alpha = .7) + scale_fill_manual(values = c('group2' = 'black', 'group1' = 'white')) + theme_void_complete() + ggtitle("Remplissage") p_fill ``` <!-- --> ] --- class: full, center, middle <img src="lab02-perception-colors_files/figure-html/unnamed-chunk-11-1.png" width="2000px" /> --- class: full ### Les couleurs dans ggplot2 `display.brewer.all()`  --- ## TODO: couleurs #### Charger le dataset diamonds et créer un sous-dataset aléatoire de 1000 lignes #### Plot carat en fonction du prix et de la couleur #### changer la palette par défaut vers une autre palette disponible --- ## TODO: couleurs 2 #### Plot carat en fonction du prix avec carat en double encodage #### Aller sur [http://colorbrewer2.org]() et trouver une palette divergente #### Créer une palette custom basée sur cette palette et l'appliquer au plot précédent #### Caler la palette sur le carat moyen #### Annoter le plot avec une ligne désignant le carat moyen et un texte expliquant cette ligne --- ```r dsamp <- diamonds[sample(nrow(diamonds), 1000), ] ggplot(dsamp, aes(carat, price)) + geom_point(aes(colour = color)) + scale_color_brewer(palette = "Set3") + facet_wrap(~color) ``` <!-- --> ```r ggplot(dsamp, aes(carat, price)) + geom_point(aes(colour = carat)) + scale_color_distiller(palette="RdYlBu") ``` <!-- --> ```r #showtext_auto() #font_add_google("Schoolbell", "bell") font_family = "sans" annotate_color = "grey50" midpoint = (max(dsamp$carat)-min(dsamp$carat))/2 ggplot(dsamp, aes(carat, price)) + geom_vline(xintercept = midpoint, color = annotate_color) + geom_point(aes(colour = carat)) + scale_color_gradient2(low = "#d8b365", mid="#f5f5f5", high="#5ab4ac", midpoint = midpoint) + annotate("text", x=.78, y=15000, hjust=1, srt=40, label ="this is the midpoint", family=font_family, color=annotate_color) + annotate("curve", x = .8, xend=midpoint-.01, y=15000, yend = 14000, curvature = -.5, color=annotate_color , arrow=arrow(length = unit(0.03, "npc") )) + theme_elegant() + theme(panel.grid.minor = element_blank(), panel.grid.major.x = element_blank(), legend.position = "none") ``` <!-- -->