
 Maxime Wack
b7a235051c
Maxime Wack
b7a235051c
|
6 роки тому | |
|---|---|---|
| Data | 7 роки тому | |
| Docs | 7 роки тому | |
| .gitignore | 7 роки тому | |
| 01_Import.Rmd | 6 роки тому | |
| 02_Tidy.Rmd | 6 роки тому | |
| 03_Transform.Rmd | 6 роки тому | |
| 04_Analyse.Rmd | 6 роки тому | |
| 05_Report.Rmd | 6 роки тому | |
| LICENSE | 7 роки тому | |
| README.md | 6 роки тому | |
README.md
tidyflow: a workflow that fits the tidyverse
Tidyflow is not a package, but a project skeleton that you can clone/fork to start your own projects.
It follows the project structure proposed by Hadley Wickham in R for Data Science
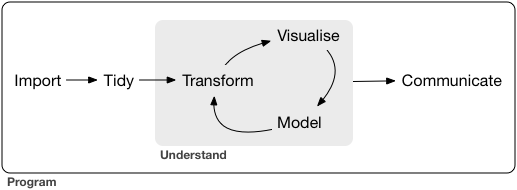
Image under CC-BY-NC-ND
Install
If you are on github, simply fork the repo.
If you don't want to use github as your remote, clone the depo in a new directory
git clone https://www.github.com/maximewack/tidyflow new_project
Then change the git remote origin to your own remote repo.
git remote set-url your_repo_url
The project already contains a .gitignore file for R projects.
Add rules for your data files if you don't want them to be shared.
Also run install.packages(c("tidyverse", "rmarkdown", "knitr")) to install the necessary dependencies.
Directory structure
The project contains two subdirectories: Data/ and Docs/.
Data/ also contains a Raw/ subdirectory.
Data/Raw/ should contain the raw data when they exist as files (csv, xls(x), SQLite databases, SAS files, SPSS files, etc.).
Docs/ should contain all external documents you have about the project (synopsis, context articles/presentations, etc.)
Scripts
Five scripts are already present, populated with boilerplate code for each of the steps.
Each of the scripts is an Rmd file, though they are not supposed to be knitted but more or less used like a notebook.
Packages dplyr, magrittr, tidyr, and purrr can be useful all the way.
Every step makes a “savepoint” of your work, allowing you to rapidly iterate on any of the steps without having to re-run the previous ones (unless you've changed something up in the chain).
01_Import.Rmd
The first script is used to import raw data (whatever the source) and save a local csv copy in Data/.
Useful packages from the tidyverse here are readr, readxl, rvest, haven, and jsonlite.
Having the data ready as simple csv is useful to always be able to start from the beginning, even if the original source is unavailable.
02_Tidy.Rmd
This step consists mostly of “non-destructive” data management: assign types to columns (factors with correct/human readable levels, dates, etc.), correct/censor obviously abnormal values and errors), transform between long and wide format, etc.
Useful packages here are lubridate, stringr, and forcats.
The results are saved in a Data/tidy.rds file.
After this second step, you will have your full data ready to use in R and shouldn't have to run the first two steps anymore (unless you get hold of new data).
03_Transform.Rmd
This script is for data transforming. It will contain all transformations of the data to make them ready for analyses.
Some “destructive” data management can occur here, such as dropping variables or observations, or modifying the levels of some factors.
Useful packages here are forcats, lubridate, and stringr.
The results are saved in a Data/transformed.rds file.
04_Analyze.Rmd
This script will contain more data transforming, and the analyses with production of the resulting tables and plots.
There is a bit of an overlap between 03_Transform.R and 04_Analyze.R as it is often an iterative process. Both files can be merged into one, but it can be useful to have some time-consuming transformations in a separate script and have the results handy.
Useful packages here are broom, ggplot2, and modelr.
In this script all the “interesting results,” full tables and ggplot graphs are included in a single hierarchical list, saved in a Data/results.rds file.
All the results from the analyses should be saved as-is without transformation, so that every result can be used in the Rmd.
Having all the results pre-computed for the Rmd means that it will take mere seconds to re-compile, while still having access to all the results if you want/need to use them somewhere in the manuscript/report.
The results object can look like this:
results
├─ tables
│  ├─ demographics
│  ├─ ttt_vs_control
│  └─ table3
├─ list_of_interesting_values
├─ interesting_values2
└─ plots
   ├─ figure1
   ├─ figure2
   └─ figure3
05_Report.Rmd
The Rmd file should not contain any literal values: every number, table, graph has to come from the results object (in its original form).
Only some really minor cosmetic modifications should be made then (running prettyNum on numerics or table columns, select/filter/arrange/rename on the full tables, etc.)
Multiple Rmds can be made using the same results: one for a full blown scientific article, one for a quick report, one for a presentation, etc.
You will never have to check again for discrepancies between tables/figures and text, or even between different media.